How to analyze core dump files of Siebel process
10. 8. 2020

To know and understand the root cause of a crash of any Siebel process can marginally improve the quality of service Siebel CRM is providing to customer. In this blog we will describe how to setup the generation of the core files and how to determine the place in code, which causes the crash of the process. Knowing the rootcause then speed up process of developing the patch or getting any kind of workaround that minimizes occurence or even fix the problem.
There are various Siebel processes (binaries) and various types of their crashes. The most probably the crash occurs for processes: siebmtshmw, srvrmgr, siebsess. The most interesting is to know the root causes of crash of siebmtshmw – Siebel multithreaded process usually Application Object Manager. Generally, there can be two types of crash.
Firstly, process has reached its maximum memory allocation and no more dynamic memory can be allocated. Then Siebel process crashes due to null pointer allocation returned by C/C++ language memory allocation function. This type of crash can be easily recognized by the size of core dump. Siebel is 32bit process so it can address up to 4GB of memory. If the coredump file reaches 4GB, rootcause of the crash is reaching max size of the process. In this case we advise to consider reconfiguration of Siebel Enterprise to increase the capacity, because the most probably, too few Object manager processes cannot handle the capacity, number of users.
Secondly, the process may crash due to problem in the code. Each C/C++ programer certainly knows some causes of crashes. Simply say, not all possible checks and handling are considered in the code. For example, null pointer exception, address memory outside allocated space, etc. These types of crashes are without debugging very difficult to find, using logs can give the hint are just very coarse estimate. So to identify the exact place in code, where the process crashes is so very appreciated.
Set up generation of core dump files
For each Linux distribution, the procedure how to setup the generation of core dump files slightly differs. We will focus on Red Hat Enterprise Linux and on SUSE Enterprise Linux, the 2 most common distribution, Siebel is running on.
For all Linux distribution, comes from kernel, it is needed to set up ulimit size for core dumps. To list ulimit sizes, type ulimit -a into console. It is needed, that ulimit size for core dump has value: unlimited. This can be done with command: ulimit -c unlimited
Command should be invoked before starting Siebel processes, so the best placement of this command is in file .bashrc or .bash_profile respectively of the technical user Siebel process are run under. Easy check is to logout and login of the technical user and run ulimit -a command to see if setting takes the effect. Setting ulimit -c should be enough to allow generation of core files. If not, here are some more details and steps how enable core dump files generation under:
RHEL: https://access.redhat.com/solutions/56021
SUSE: https://www.suse.com/support/kb/doc/?id=000015982
File [/proc/sys/kernel/]core_pattern is used to specify a core dumpfile pattern name. Core dump files are stored by default in following directory: /var/lib/systemd/coredumps
Once we find the coredump file, if it is gzipped, we unzip it and we can use gdb to debug the core file.
To start gdb debugger type: gdb process_name corefile
The example is in the following screenshot.
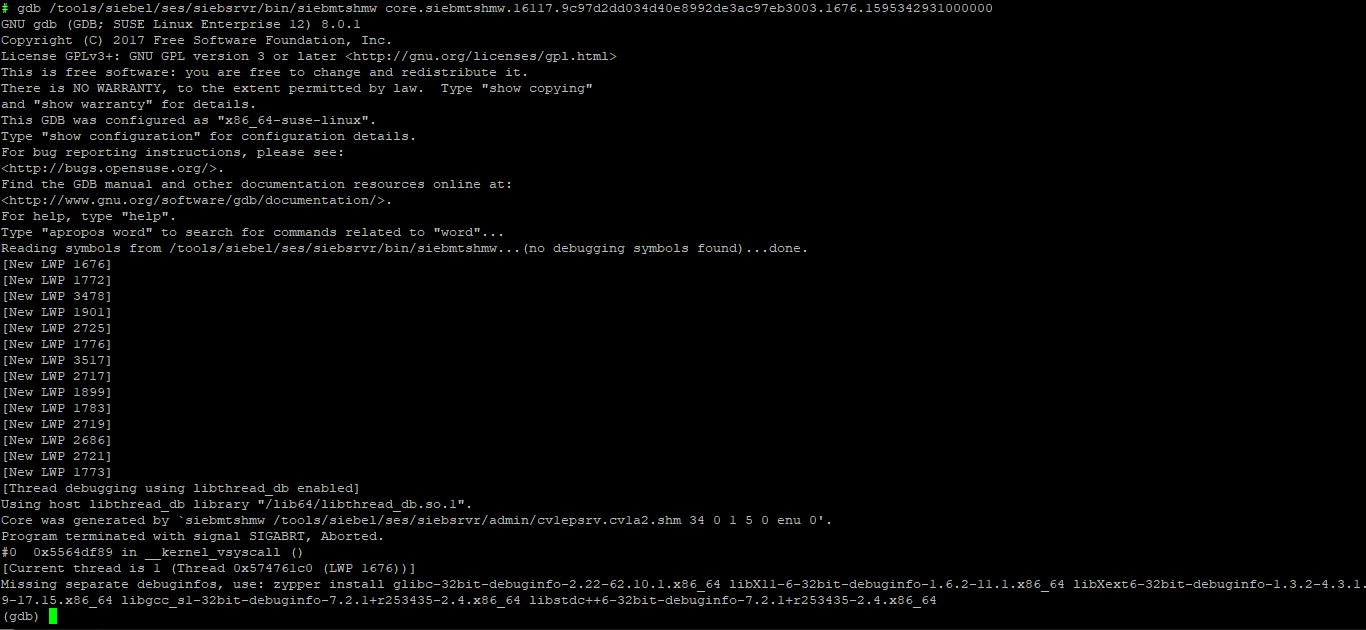
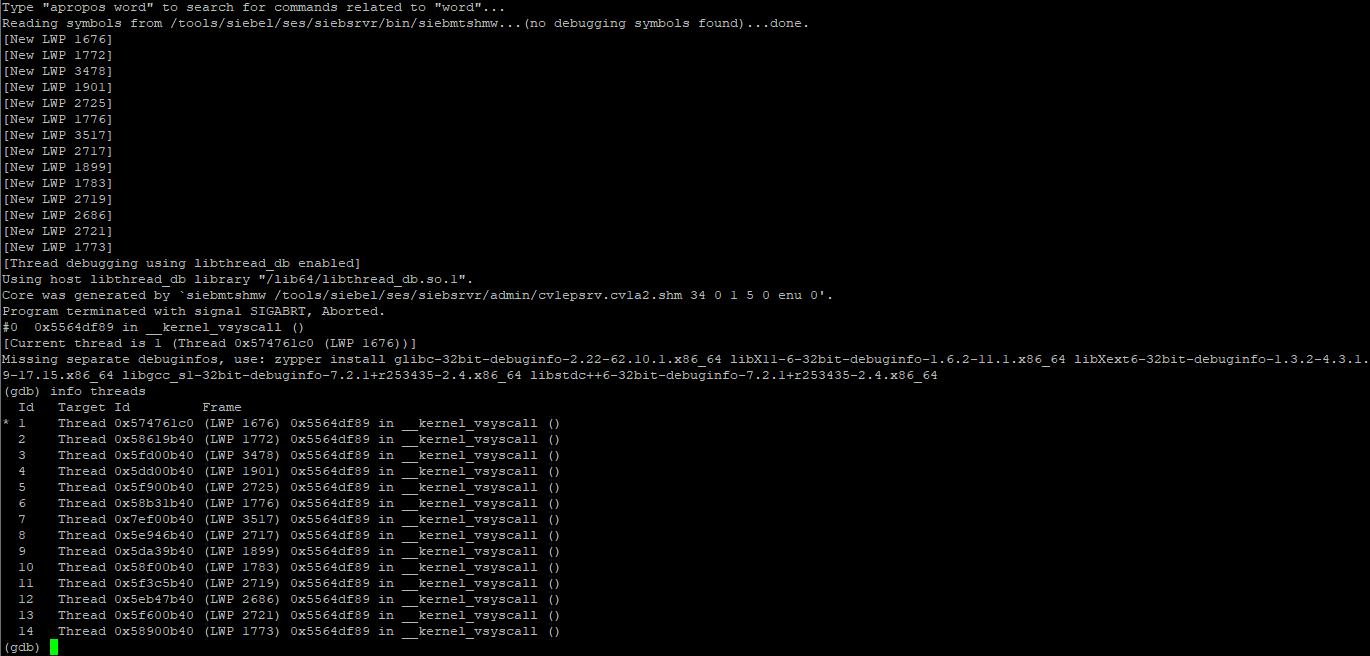
gdb lists us the thread the process have had in time of the crash. We are interested in thread that crashes. This can be recognized using command: info threads
Details can be seen in the following screenshot.
To see the thread callstack, type command: backtrace
The callstack of all threads can be seen using command: thread apply all where, see the screenshot.
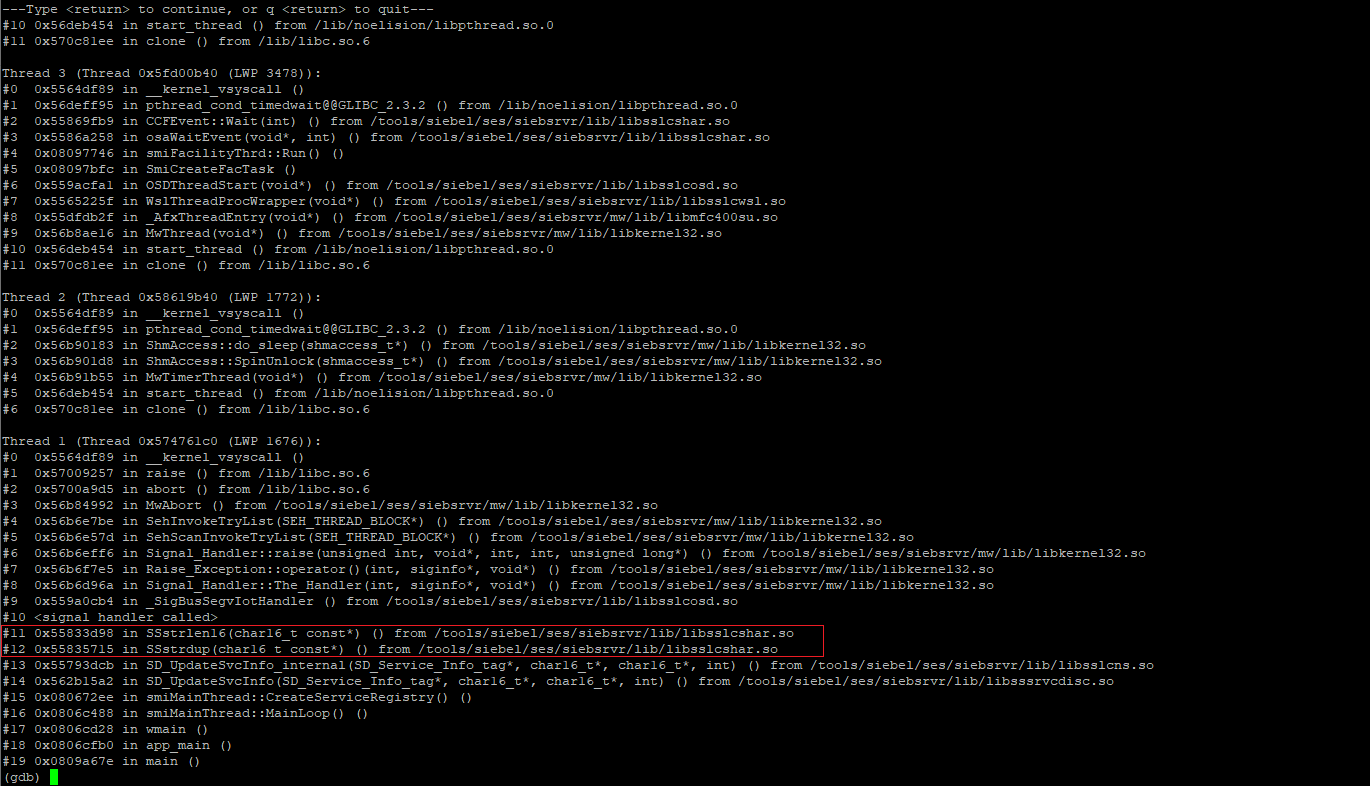
In this particular example, we see, that the Object Manager has crashed in function when manipulating with strings, probably null pointer or accessing memory beyond the allocated char array. This result of debugging provides us very solid situation for iteration to the solution.
gdb is very powerfull tool and not just for debugging running programs but core dumps as well. Hope this blog has helped you get some insight in topic of core file analysis.
Späť na Blog