How to add chart in Siebel Open UI List Applet
3. 5. 2018

We were trying to ease the work of our Siebel Administrators by providing them with nice graphs for each interface and model error log. With Siebel Open UI framework as it is modern HTML5 UI framework using javscripts, css and jquery components it was quick and effective to use open javascript plugin and provide our administrators some easy at their daily burden monitoring huge enterprise application.
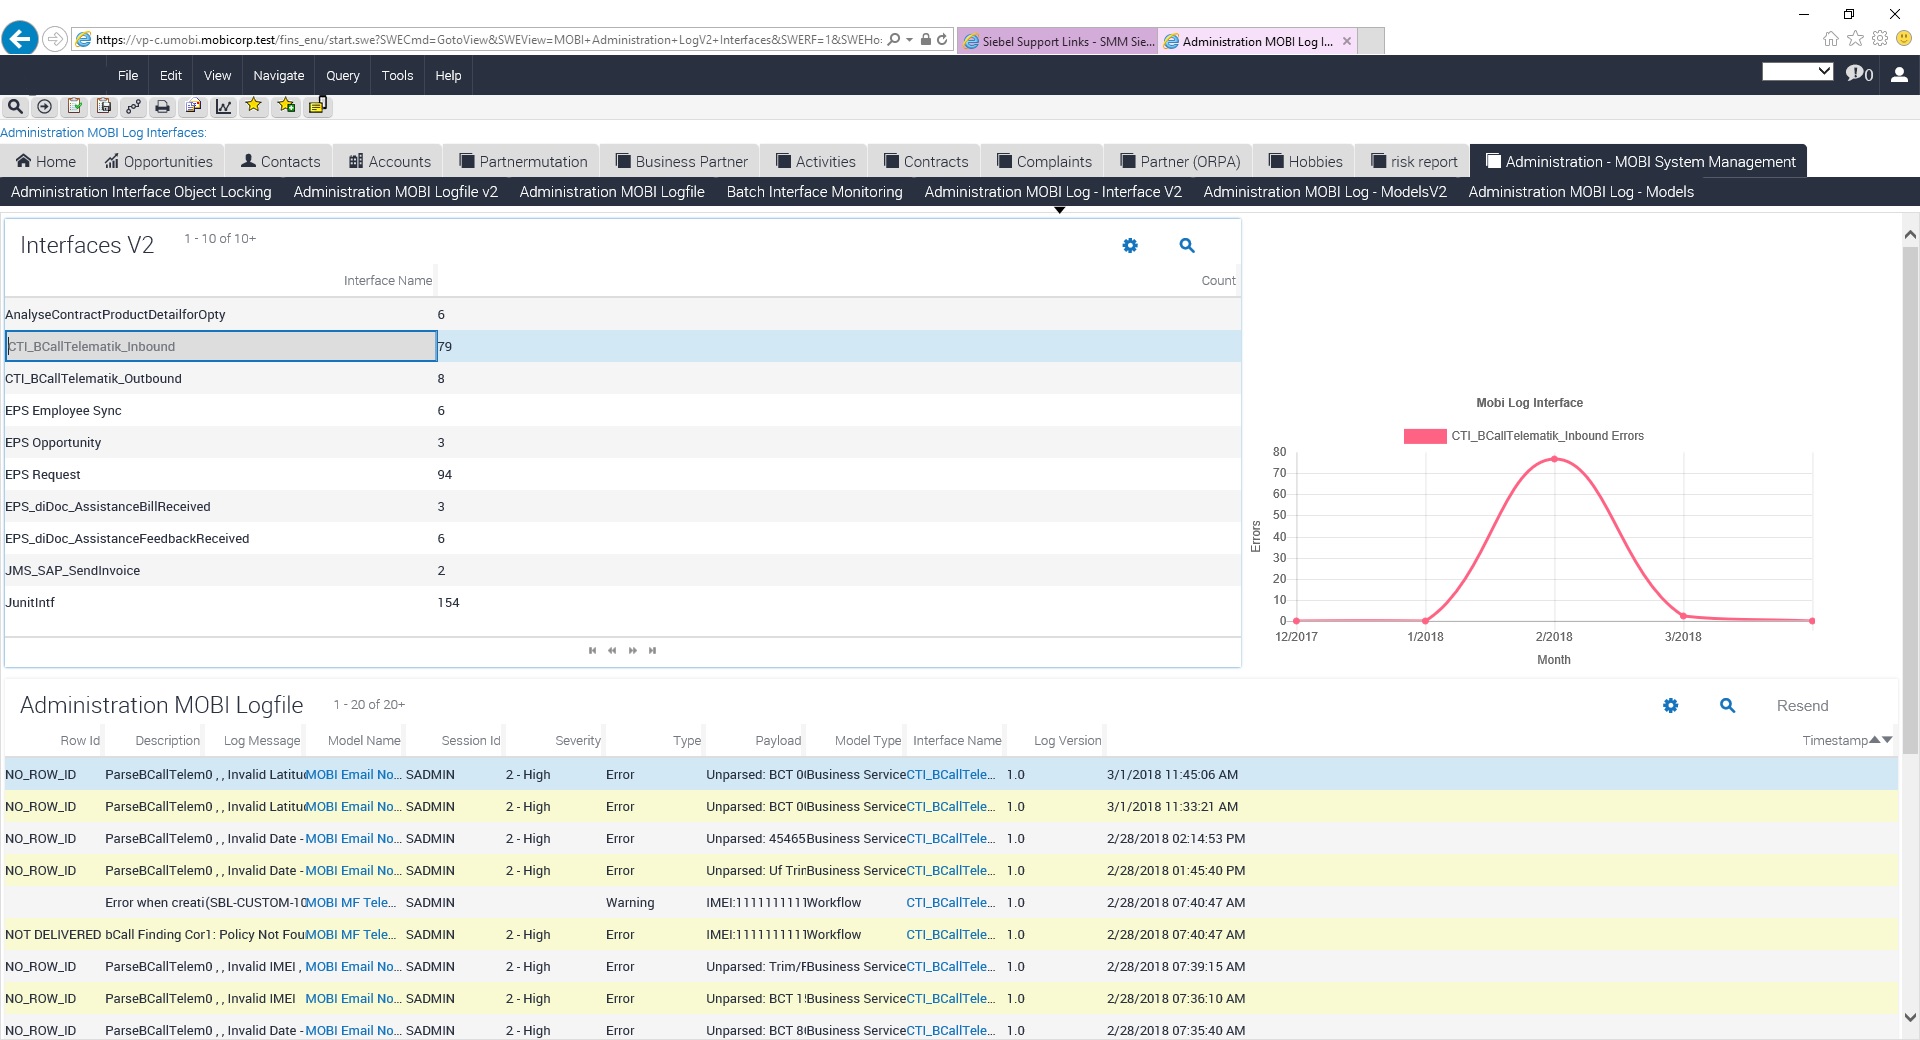
We decided for Chart.js (http://charts.org) and we have injected it into our custom log list applets. This is what we achieved (For copyright reasons I am attaching aurora screenshot ) :

We used standard PM and PR Siebel Open UI Scripts to add the plugin into Siebel List Applet. We also implemented Server Business Service which queries and prepares the data for x and y axes. The Presentation Model reacts on row click within the List applet, which gaines the focus and calls the PR which retrieves from Siebel Server and DB through Business Service the data, binds the chart plugin and draws the chart.
Here is Presentation Model Scripts :
if (typeof(SiebelAppFacade.MOBIGraphInterfaceV2PM) === "undefined") {
SiebelJS.Namespace("SiebelAppFacade.MOBIGraphInterfaceV2PM");
define("siebel/custom/MOBIGraphInterfaceV2PM", ["siebel/listpmodel"],
function () {
SiebelAppFacade.MOBIGraphInterfaceV2PM = (function () {
function MOBIGraphInterfaceV2PM(pm) {
SiebelAppFacade.MOBIGraphInterfaceV2PM.superclass.constructor.apply(this, arguments);
}
SiebelJS.Extend(MOBIGraphInterfaceV2PM, SiebelAppFacade.ListPresentationModel);
MOBIGraphInterfaceV2PM.prototype.Init = function () {
// Init is called each time the object is initialised.
// Add code here that should happen before default processing
SiebelAppFacade.MOBIGraphInterfaceV2PM.superclass.Init.apply(this, arguments);
// Add code here that should happen after default processing
this.AddProperty("MOBIGraph", "");
this.AddMethod("OnCtrlFocus", ChangeRecord,{sequence : false, scope: this});
}
function ChangeRecord(){
var controls = this.Get("GetControls");
var control = controls[ "Interface Name" ];
if (control == null )
control = controls[ "Interface Name" ];
if (control != null ) {
var value = this.ExecuteMethod("GetFieldValue", control);
this.SetProperty("MOBIGraph", value);
}
}
return MOBIGraphInterfaceV2PM;
}()
);
return "SiebelAppFacade.MOBIGraphInterfaceV2PM";
})
}
Here is the Physical Renderer script :
if (typeof(SiebelAppFacade.MOBIGraphInterfaceV2PR) === "undefined") {
SiebelJS.Namespace("SiebelAppFacade.MOBIGraphInterfaceV2PR");
define("siebel/custom/MOBIGraphInterfaceV2PR", ["siebel/jqgridrenderer","siebel/custom/Chart_bundle.js"],
function () {
SiebelAppFacade.MOBIGraphInterfaceV2PR = (function () {
function MOBIGraphInterfaceV2PR(pm) {
SiebelAppFacade.MOBIGraphInterfaceV2PR.superclass.constructor.apply(this, arguments);
}
SiebelJS.Extend(MOBIGraphInterfaceV2PR, SiebelAppFacade.JQGridRenderer);
MOBIGraphInterfaceV2PR.prototype.Init = function () {
// Init is called each time the object is initialised.
// Add code here that should happen before default processing
SiebelAppFacade.MOBIGraphInterfaceV2PR.superclass.Init.apply(this, arguments);
// Add code here that should happen after default processing
var appletFullId = this.GetPM().Get("GetFullId");
$("#"+appletFullId).append("<div id='div_canvas'></div>");
$("#div_canvas").append("<canvas id='canvas'></canvas>");
$("#s_"+appletFullId+ "_div").css({"display": "inline-block", "width": "65%"});
$("#div_canvas").css({"display": "inline-block", "width": "30%"})
this.AttachPMBinding("MOBIGraph", ChartGraph);
}
function ChartGraph(){
$("#canvas").remove();
$("#div_canvas").append("<canvas id='canvas'></canvas>");
var oSvc = SiebelApp.S_App.GetService("MOBI Common Browser Helper");
var iPS = SiebelApp.S_App.NewPropertySet();
var oPS = SiebelApp.S_App.NewPropertySet();
var value = this.GetPM().Get("MOBIGraph");
if(value != ""){
console.log("valuePM: "+value);
iPS.SetProperty("MOBI Months", "4");
iPS.SetProperty("MOBI Interface", value);
iPS.SetProperty("MOBI Type", "Error");
iPS.SetProperty("MOBI LogVersion", "1.0");
console.log(iPS);
oPS = oSvc.InvokeMethod("MOBIGraphData", iPS);
oPS = oPS.GetChildByType("ResultSet");
}
var labela = oPS.GetProperty("MOBI Labels").split(";");
var countera = oPS.GetProperty("MOBI Counters").split(";");
var config = {
type: 'line',
data: {
labels: labela,
datasets: [{
label: value + " Errors",
backgroundColor: 'rgb(255, 99, 132)',
borderColor: 'rgb(255, 99, 132)',
data: countera,
fill: false,
}]
},
options: {
responsive: true,
title:{
display:true,
text:'Mobi Log Interface'
},
tooltips: {
mode: 'index',
intersect: false,
},
hover: {
mode: 'nearest',
intersect: true
},
scales: {
xAxes: [{
display: true,
scaleLabel: {
display: true,
labelString: 'Month'
}
}],
yAxes: [{
display: true,
scaleLabel: {
display: true,
labelString: 'Errors'
}
}]
}
}
};
var ctx = document.getElementById("canvas").getContext("2d");
console.log(config);
var mychart;
mychart= new Chart(ctx, config);
mychart = null;
config = null;
ctx = null;
oSvc = null;
iPS = null;
oPS = null;
}
MOBIGraphInterfaceV2PR.prototype.ShowUI = function () {
// ShowUI is called when the object is initially laid out.
// Add code here that should happen before default processing
SiebelAppFacade.MOBIGraphInterfaceV2PR.superclass.ShowUI.apply(this, arguments);
// Add code here that should happen after default processing
} return MOBIGraphInterfaceV2PR;
}()
);
return "SiebelAppFacade.MOBIGraphInterfaceV2PR";
})
}
We wanted to inspire you and show how easy and quick you can improve the user experience for Siebel Open UI. Enjoy. If you are interested in such a ideas or deliveries, contact us.
Späť na Blog