Improving Tomcats memory management for Siebel application
1. 3. 2021

Tomcat application server plays an important role in Oracle Siebel CRM IP17+ architecture. Since IP17 Siebel CRM uses Tomcat as the application container in the architecture, as can be seen here: https://www.siebelhub.com/main/2019/06/siebel-2019-get-a-grip.html
Therefore, the stability of Tomcat strongly influences the performance of the whole Siebel enterprise.
In this blog we will share with you the Tomcat Java Options to improve memory management and garbage collection of all Tomcats in the Siebel IP18+ architecture. From the diagram in here one can see, Siebel since IP17 contains three different types of Tomcats. Between IP17 and IP18 are changes concerning the Gateway, this has become clustered with IP18 and therefore IP18 is the minimum version to cope with. Properly configured memory management and garbage collection can massively improve performance and stability of application deployed in Tomcat. Java offers many parameters that influence and finetune memory usage and garbage collection. The list of all options can be found here: https://www.oracle.com/java/technologies/javase/vmoptions-jsp.html
For memory heap tuning we use recommendation mentioned in https://docs.oracle.com/cd/E19900-01/819-4742/abeik/index.html
For Application containers (Gateway, Siebel application Server) we recommend maximum and initial memory heap size to be 6GB and NewSize and MaxNewSize to be one fourth of maximum memory size. Thread Stack Size to be 256KB. Survivor Ratios attributes we recommend as follows, use default SurviverRatio=8, for Target SurvivorRatio we propose 90 instead of default 50, because If the application being fine-tuned has a relatively consistent object allocation rate, it is acceptable to raise the target survivor occupancy to something as high as -XX:TargetSurvivorRatio=80 or -XX:TargetSurvivorRatio=90. The advantage of being able to do so helps reduce the amount of survivor space needed to age objects.
We set as well heap dumping to a file when out of memory is reached. To conclude, the first part of JAVA_OPTS coping with memory usage is as follows:
JAVA_OPTS ="-Xms6g -Xmx6g -XX:NewSize=1536m -XX:MaxNewSize=1536m -XX:SurvivorRatio=8 -XX:TargetSurvivorRatio=90 -XX:ThreadStackSize=256k -XX:+HeapDumpOnOutOfMemoryError -XX:HeapDumpPath=${LOGDIR}/heap_dumps"
Where ${LOGDIR} is the directory where Heap Dump on Out-of-Memory Error is logged
The second important topic in memory management is settings of garbage collector. Very useful article can be found here: Garbage Collectors - Serial vs. Parallel vs. CMS vs. G1 (and what’s new in Java 8) | OverOps When we consider Tomcat application server running either Siebel Application Container or Gateway or Application Interface, java 8 is used. Following parameters are proposed for optimal performance:
ParallelGCThreads=2
+UseConcMarkSweepGC
+UseParNewGC
The Concurrent Mark Sweep (CMS) collector is designed for applications that prefer shorter garbage collection pauses and that can afford to share processor resources with the garbage collector while the application is running. Typically applications that have a relatively large set of long-lived data (a large tenured generation) and run on machines with two or more processors tend to benefit from the use of this collector. However, this collector should be considered for any application with a low pause time requirement. Siebel Containers running in Tomcat would fit to this definition.
Along with Concurrent Mark and Sweep, directive +UseParNewGC will be included. It uses a parallel version of the young generation copying collector alongside the default collector. This minimizes pauses by using all available CPUs in parallel.
As well as disabling explicit call of garbage collector is desired, for this use directive: +DisableExplicitGC.
We can collect garbage collector logs into specific directory, in our case directory is given by variable ${LOGDIR}
JAVA_OPTS="$JAVA_OPTS -XX:ParallelGCThreads=2 -XX:+UseConcMarkSweepGC - -XX:+UseParNewGC -XX:+DisableExplicitGC -XX:+PrintGCDateStamps -XX:+PrintTenuringDistribution -XX:+PrintGCDetails -verbose:gc -Xloggc:${LOGDIR}/gc_logs/${INSTANCE_NAME}.gc.%t.log"
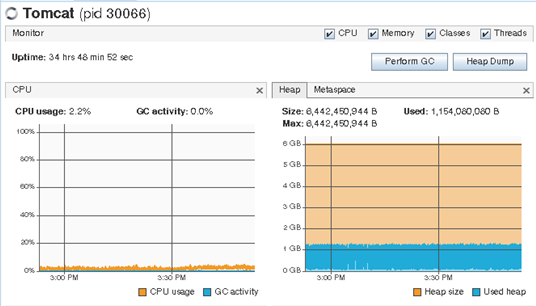
Screenshot from VisualVM application attached to Tomcat Server running Siebel Gateway container. Garbage Collector running in parallel, two GC threads, constant low CPU usage, no growing memory.

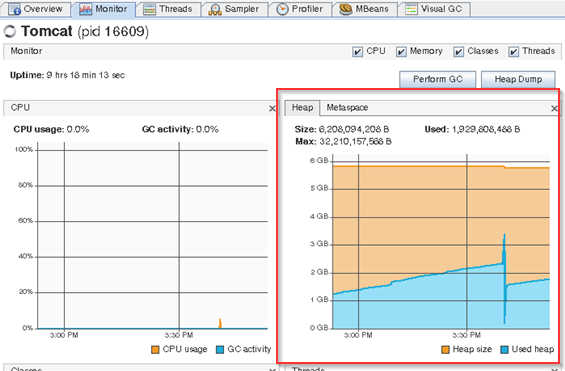
Default Java options for Siebel application containers running in Tomcat. Serial Garbage Collector. No GC threads, peak when GC is running. It results in sustain memory growing. When garbage collector is running, steep peak of consuming memory can occur as well as CPU. This can lead to temporary degradation of service. Especially Siebel Gateway is sensitive for this situation.

Back to Blog