Inspect java application memory management and use in tomcat with visualvm
30. 10. 2020

The Apache Tomcat® software is an open source implementation of the Java Servlet, JavaServer Pages, Java Expression Language and Java WebSocket technologies. It has a wide possible usage. It is also used with Oracle Siebel CRM since verion IP2016 and it is a solid and required component of Oracle Siebel CRM IP2017. Tomcat is used for deployment of zookeeper used as a replaced for siebns.dat in the Siebel gateway component but also as a config agent for the Siebel Enterprise Servers for Inbound Outbound REST/HTTP/HTPS/JMS/JDB/JCA integration. It can be also used for deploying Siebel custom Java Business Services for JSON converting, or xsltľ transformation or for implementing the business requirements occuring in the enterprise customer care processes.
Very often after new patchset installation ,deploying new Java Business Services, new interfaces using mentioned protocols leveraging tomcat it is required to inspect memory consumption and management. New functionalities ord interfaces can cause extensive memory consumption and even a memory leaks. In this blog we described how to inspect these with visual tool visualvm.
We describe the steps for the linux. We use RHEL7.9
- Download visualvm from this url : https://visualvm.github.io/download.html
- Copy and extract the downloaded visualvm to your for example /tmp/ destination folder.
- When using putty client or ssh from windows machine you will need xwindows for visualvm UI. Download and install xming xwindow server from https://sourceforge.net/projects/xming/
- Start your application in tomcat, start your load or performance test, make extensive use of your new functionality.
- go to cd /tmp/visualvm_204/bin and start ./visualvm
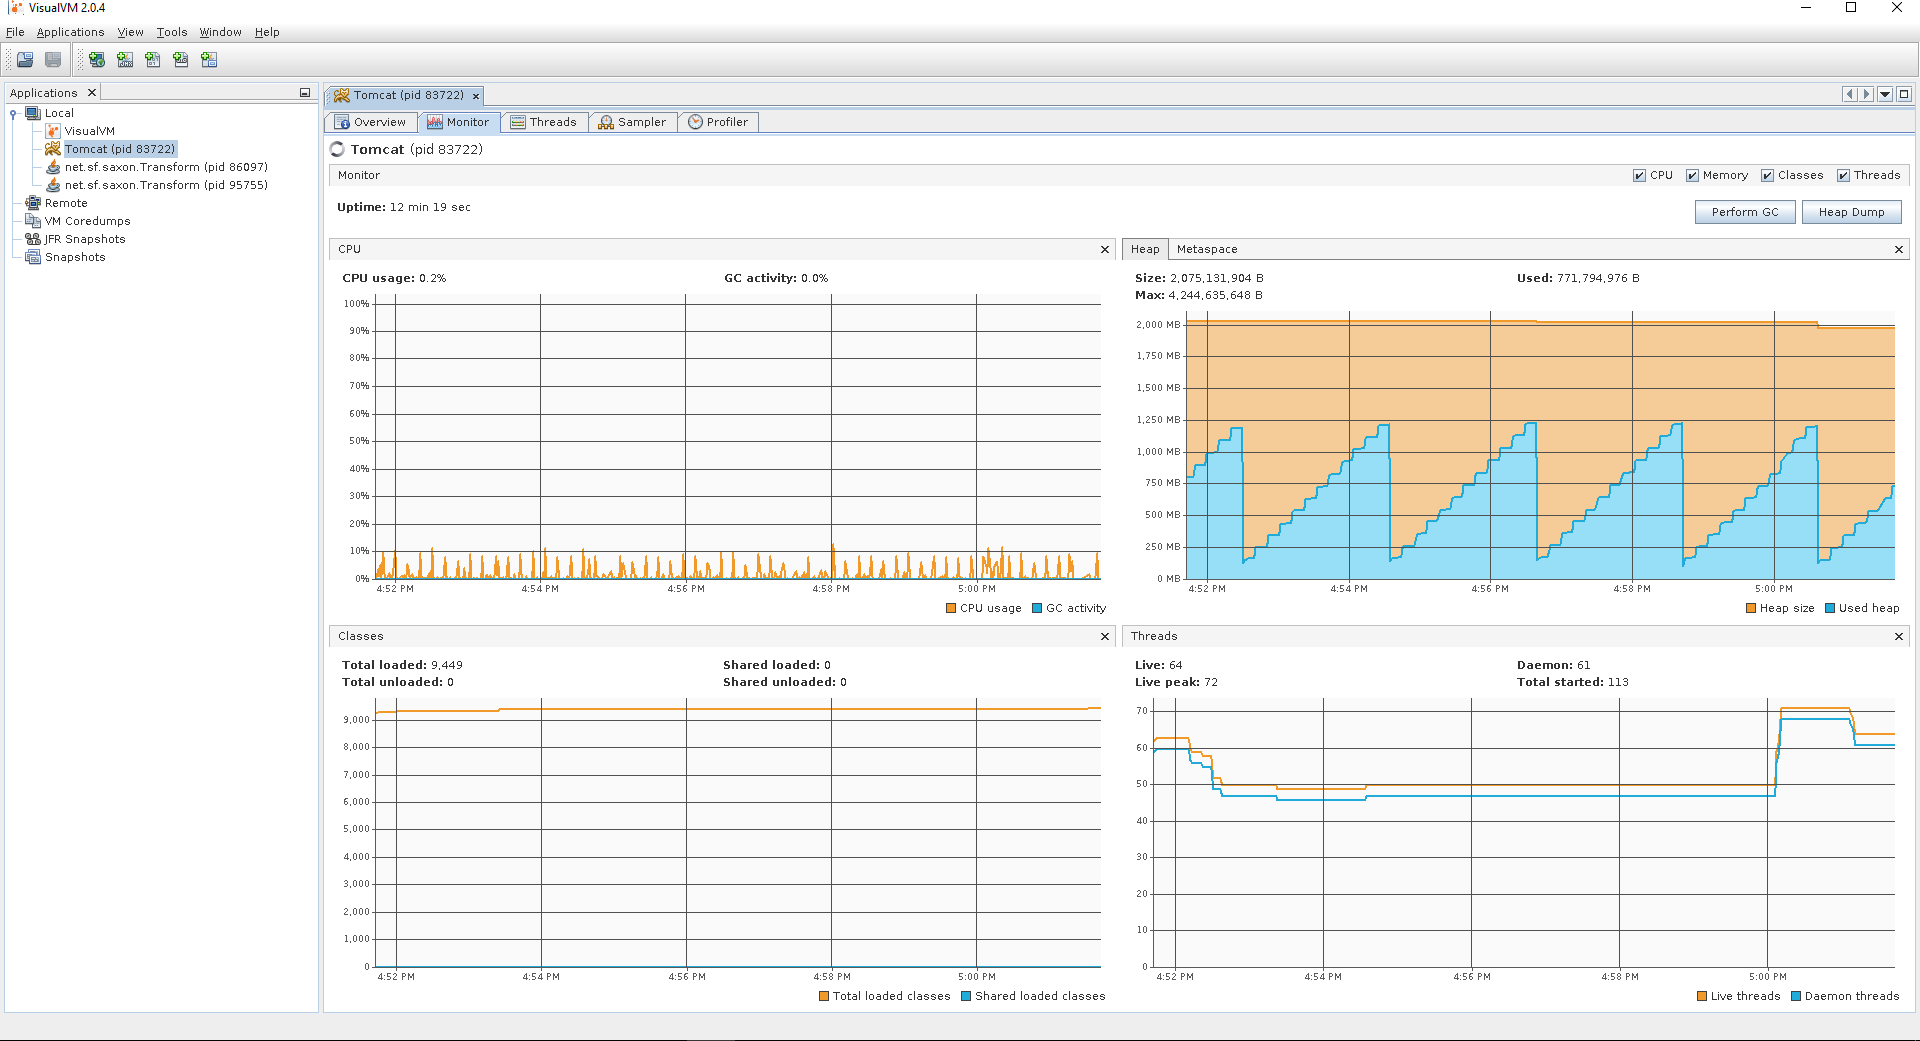
Here is one example of good memory management of your in tomcat deployed application :
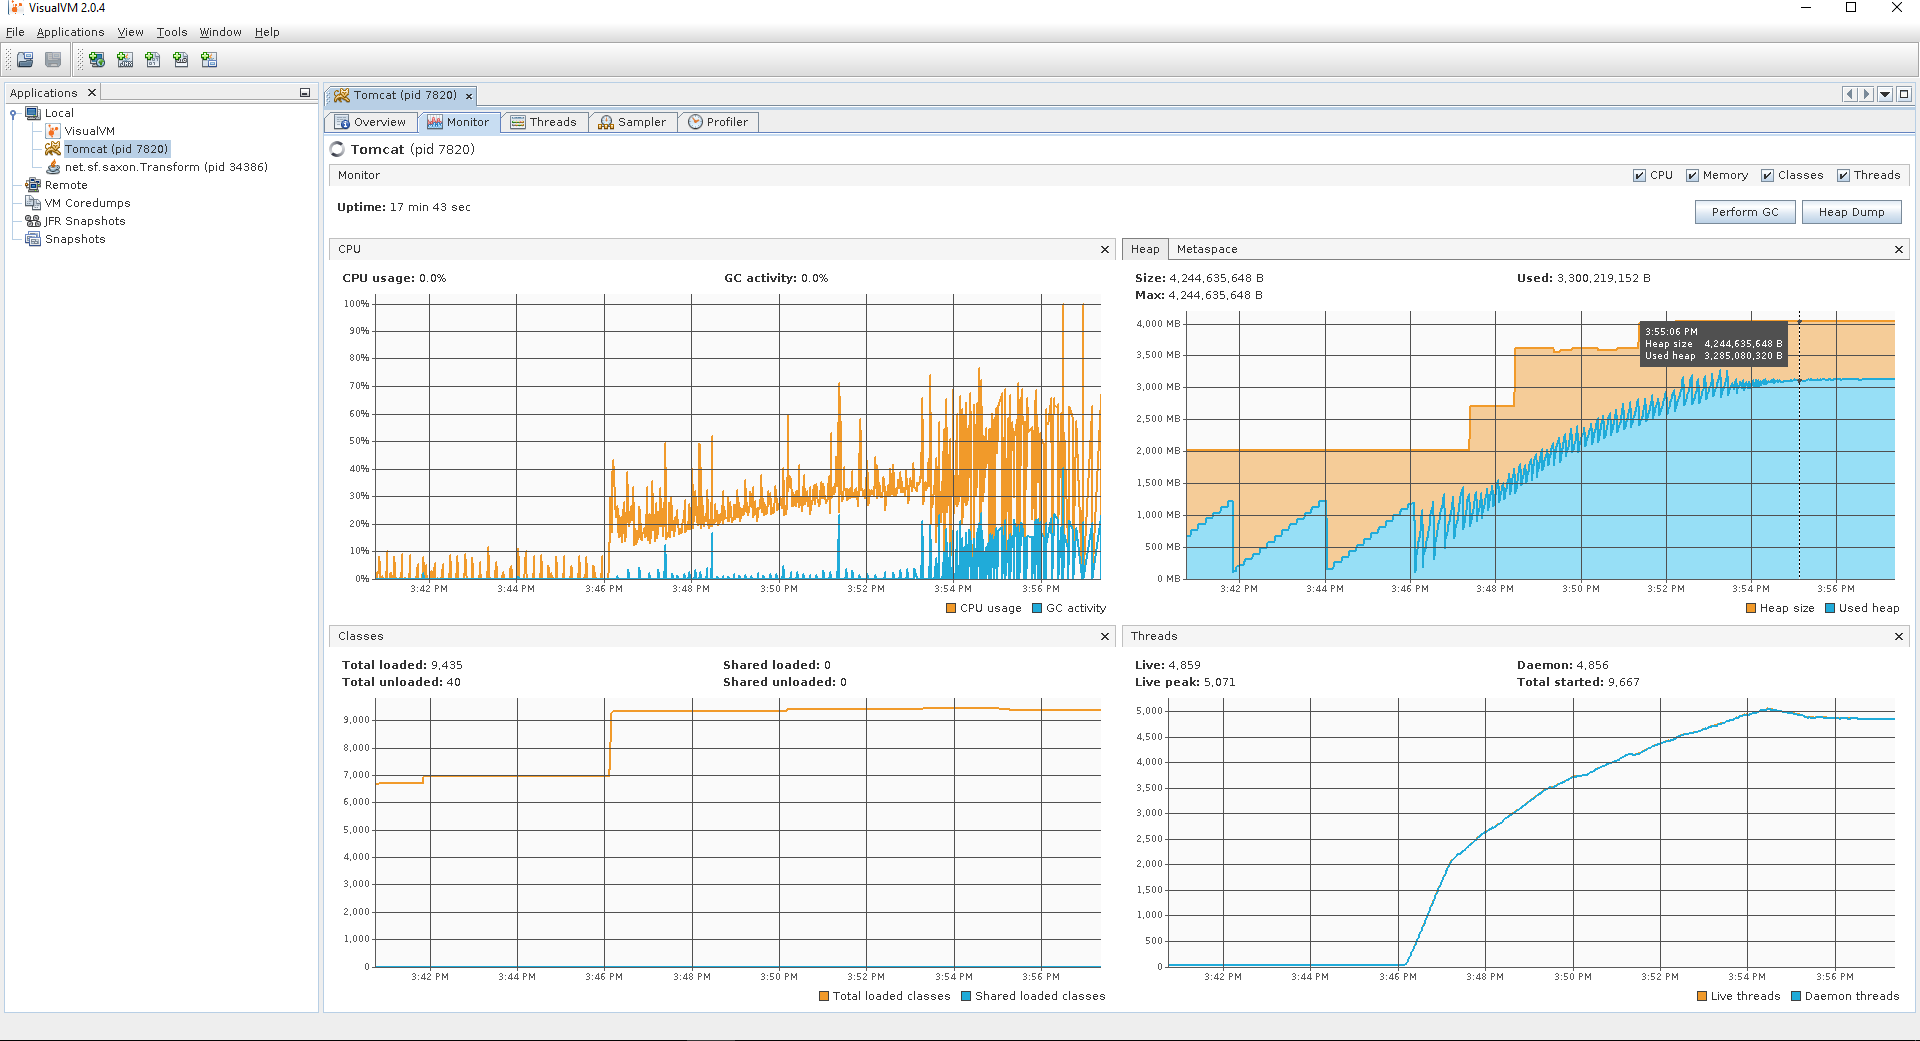
Here is an example of tomcat with heavy load using jms integration and custom java business service to convert xml to json and json to xml with xslt2 transformation.
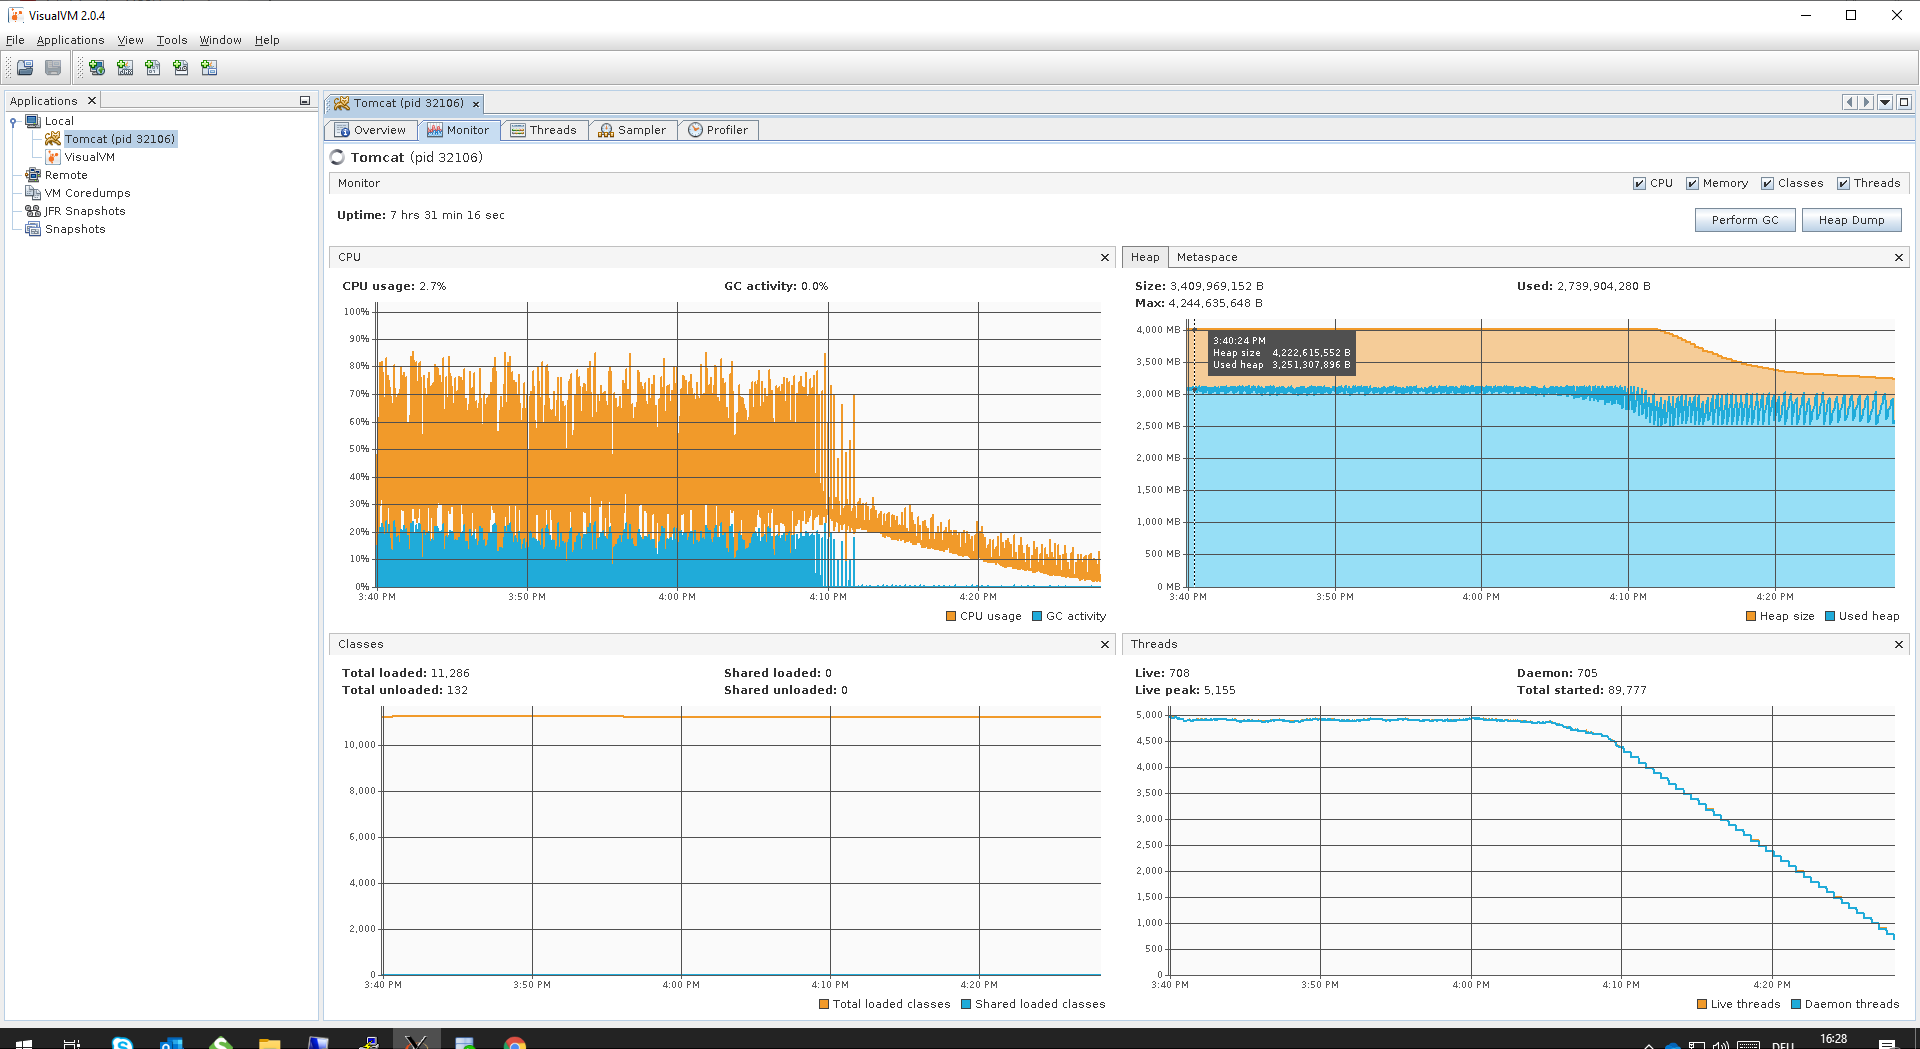
Here is an example of memory management and use in the same case of heavy load but after correcting the cause of memory leaks :
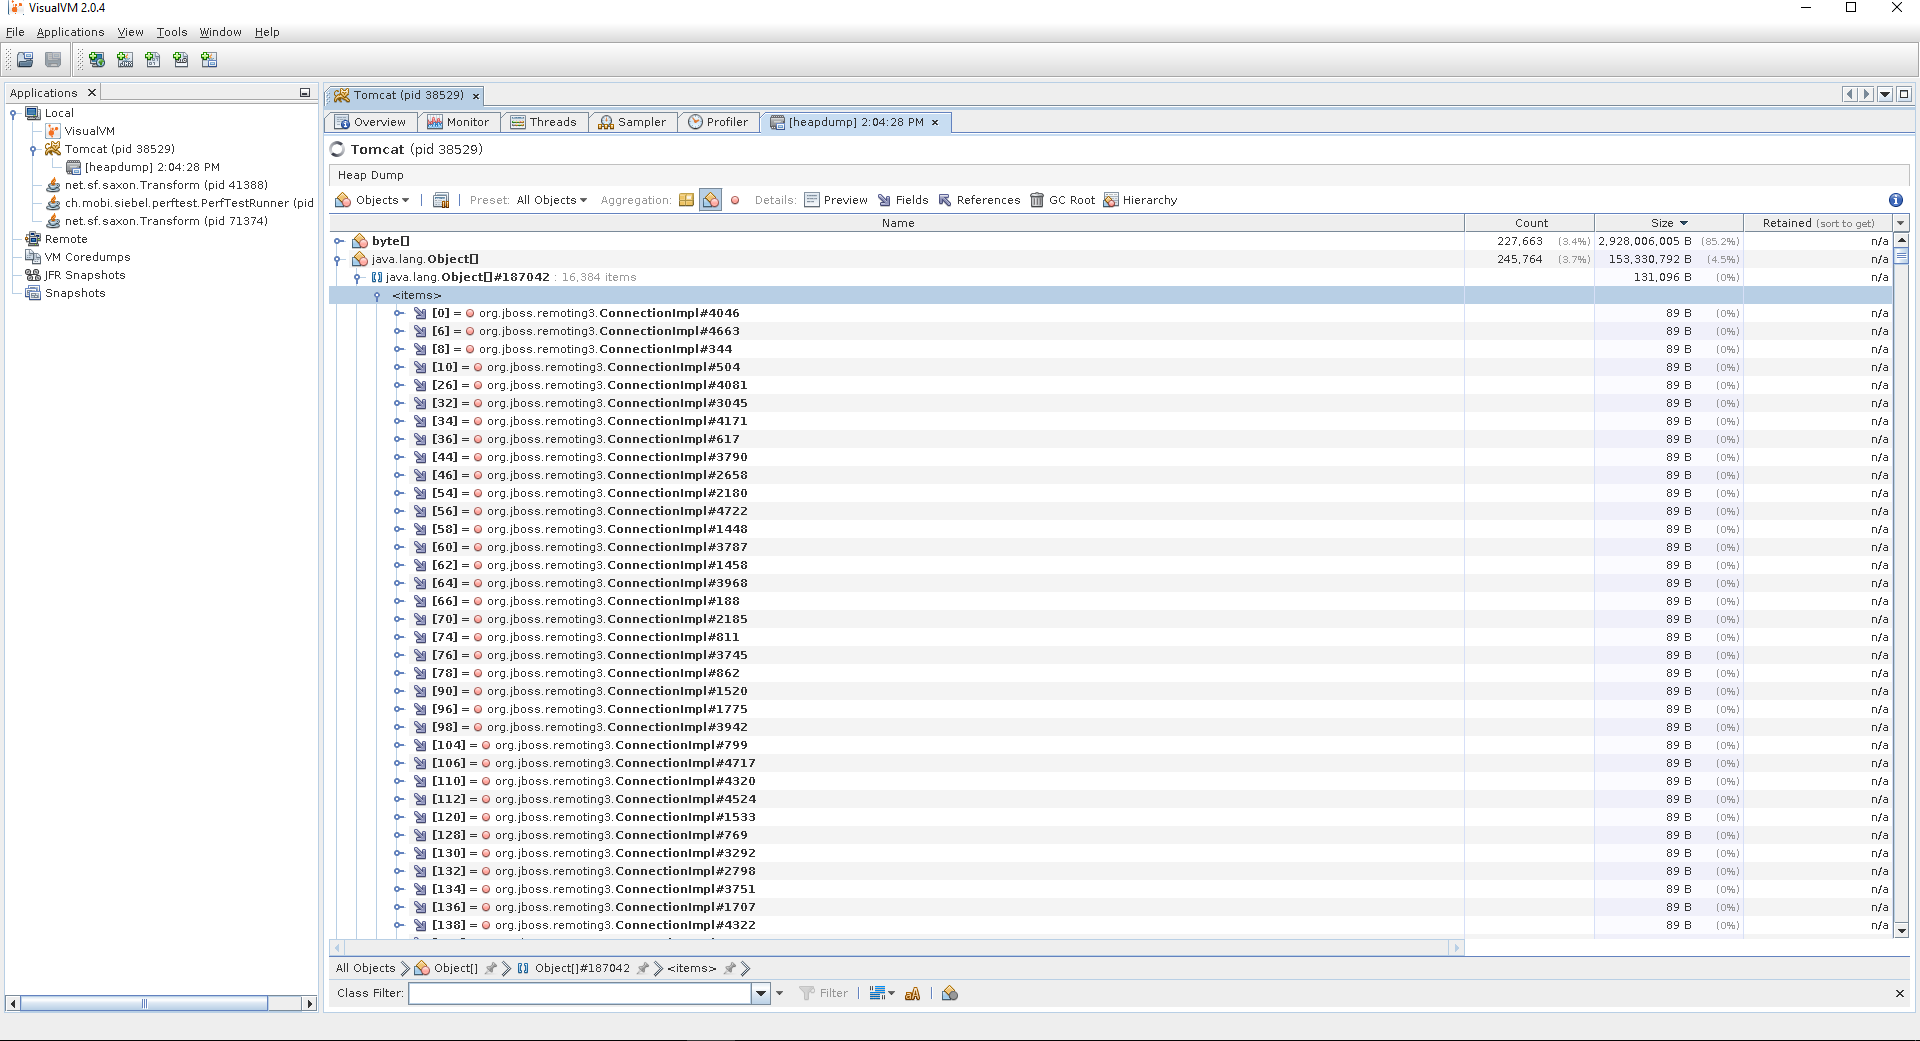
You can also inspect the not leaked objects in the memory by clicking on button Heap Dump and this way you can allocate the cause of the leak :
in case you need to revise the memory parameters read our next blog , but generally you can set them in /app/tomcat/applicationcontainer/bin/setnenv.sh in the section of
JAVA_OPTS="-verbosegc -Xms1024m -Xmx4048m"
In this example the initial heapsize is 1Gb and max heapsize 4Gb. More information you can find in our next blog or in https://www.oracle.com/java/technologies/javase/vmoptions-jsp.html
Conclusion is that it is crucial to perform a load test and inspect the management of memory within tomcat in order to prevent leaks and to tune optimal memory consumption and setting for the benefit of application stability.
Späť na Blog