How to inspect memory leaks in tomcat server for Siebel JavaBusinessServices
How to inspect memory leaks in tomcat server for Siebel JavaBusinessServices
In this blog we would like to share our experience debugging and inspecting possible memory leaks problem in Siebel JavaBusinessServices which jar are deployed in the tomcat.
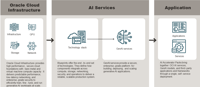
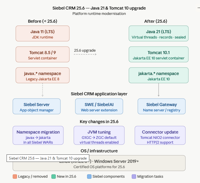
In the new Oracle Siebel CRM architecture starting with IP2017 is in every siebel server tomcat server installed. All Java classes are registered and executed in the tomcat app server.
When Siebel Business service has registered a java class to execute, Siebel Server performs http request to tomcat server which then executes the java code registered.
As we mention in the previous blog , there can be problems executing this java code. In siebel with traditional analytics methods such as log analysis and debugging we can see only final symptoms of problems such as memory leak or out of resources such as : SBL-EAI-05000: Business Service call returned error code HTTP_CONTAINERURL_TIMEOUT and message: HTTP Request to Javacontainer timed out.. See bellow log line from log :
2021 2019-05-06 10:26:39 0000-00-00 00:00:00 +0200 00000000 001 003f 0001 09 WfProcMgr 174069085 61448 -265065664 /app/siebel/sieb/siebsrvr/enterprises/ENT_MOBI_0b1/ld1c058b/log/WfProcMgr_0166_174069085.log 19.1.0.0 [23073] ENU
ObjMgrBusServiceLog Error 1 000000025cce6da5:0 2019-05-06 10:26:39 (javabsvc.cpp (536)) SBL-EAI-05000: Business Service call returned error code HTTP_CONTAINERURL_TIMEOUT and message: HTTP Request to Javacontainer timed out.
ObjMgrBusServiceLog Error 1 000000025cce6da5:0 2019-05-06 10:26:39 (jmsbsvc.cpp (381)) SBL-EAI-05000: Business Service call returned error code HTTP Request to Javacontainer timed out. and message: <?>
ObjMgrLog Error 1 000000025cce6da5:0 2019-05-06 10:26:39 (stepexec.cpp (1586)) SBL-BPR-00162: Error invoking service 'MOBI EAI JMS Transport', method 'Send' at step '90. Send JMS'.
To analyse further some tradinitional java debugging methods in the tomcat server are needed. In our case the jms send business service in the Oracle Siebel CRM IP2019 PS1 caused memory leaks. As a workaround we tried to force CloseConnection by calling undefined method ConnectionClose() which was passed to Siebel.jar and executed. After deploying this fix we have still seen memory leaks.
Here are some steps to analyse memory leaks in the tomcat server.
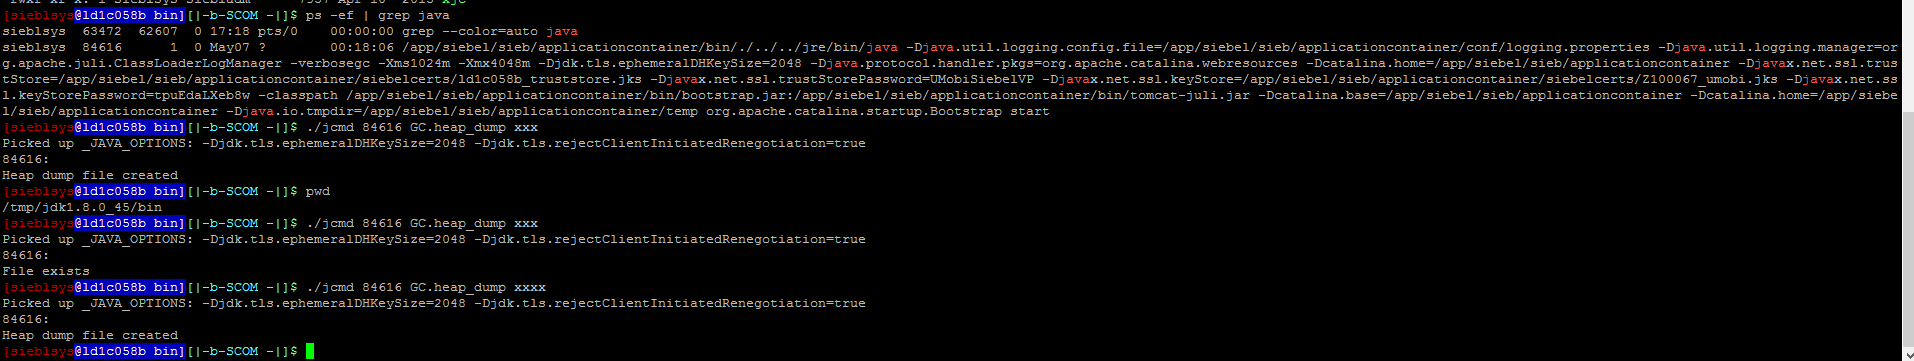
1. First identify tomcat process by
./ps -ef | grep java

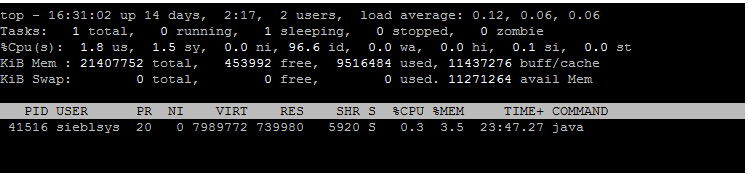
2. execute your code and look to the memory used
./top –p 41516
You can also get the heap dump of your tomcat process and analyse possible memory leaks.
3. Firstly download Visual VM for your client laptop. We have Windows 10. https://visualvm.github.io/download.html
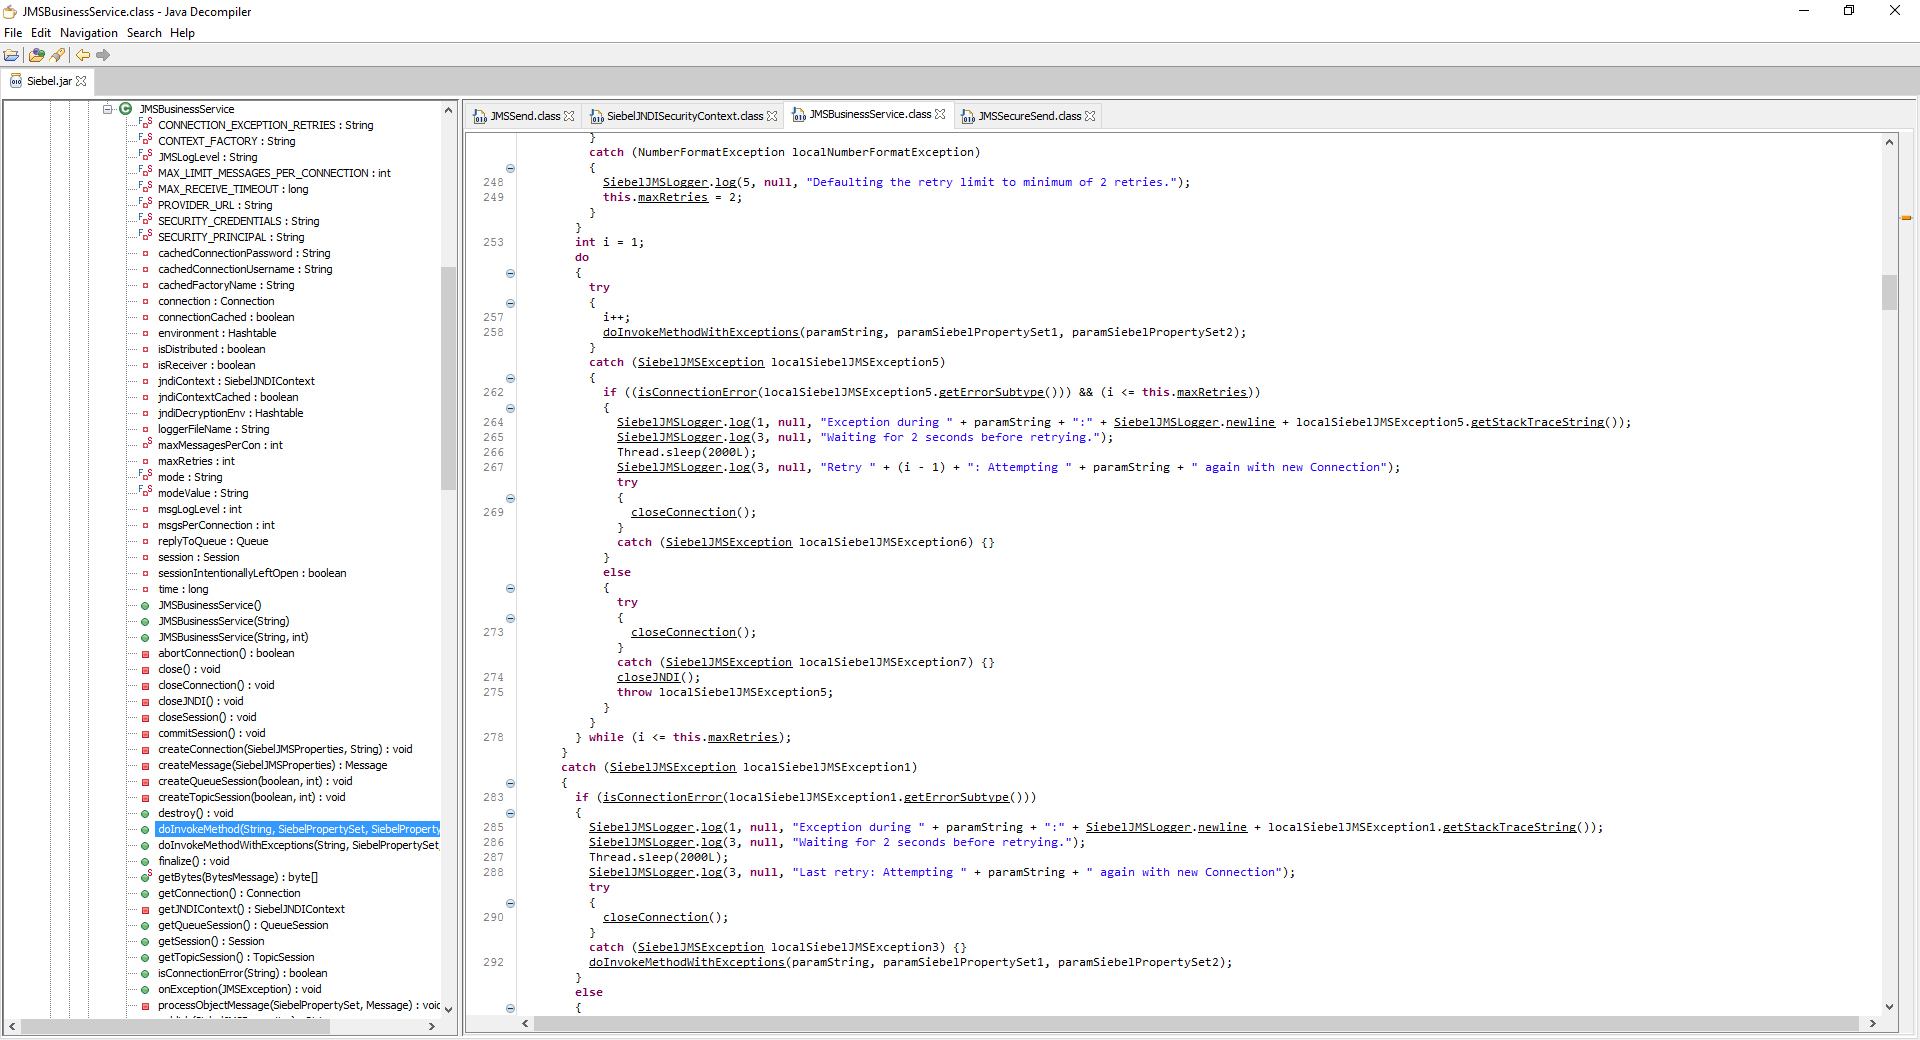
4. Download also JD-GUI to decompile java classes which are vanilla such as jms send. https://github.com/java-decompiler/jd-gui/releases
5. Connect via putty to your siebel server where the tomcat has problems.
6. Go to the jdk and its bin directory
execute :
./jcmd [pid of tomcat] GC.heap_dump nameoffile
Example
./jcmd 84616 GC.heap_dump memoryleakjms.out
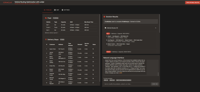
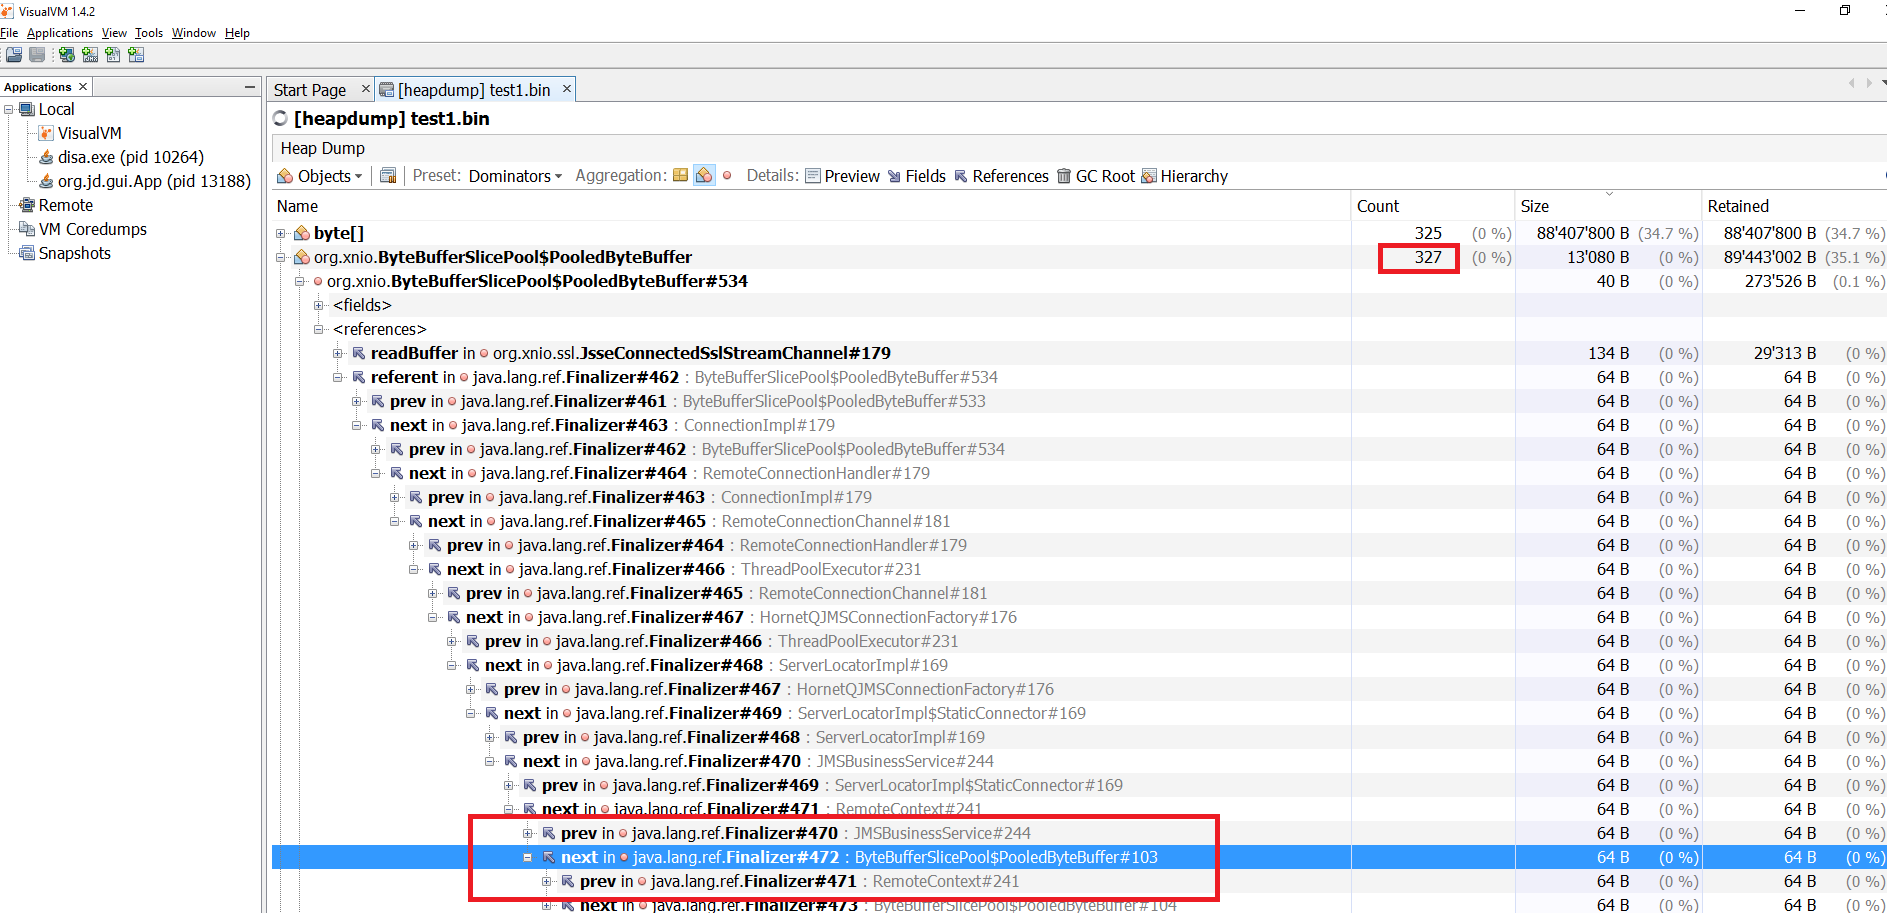
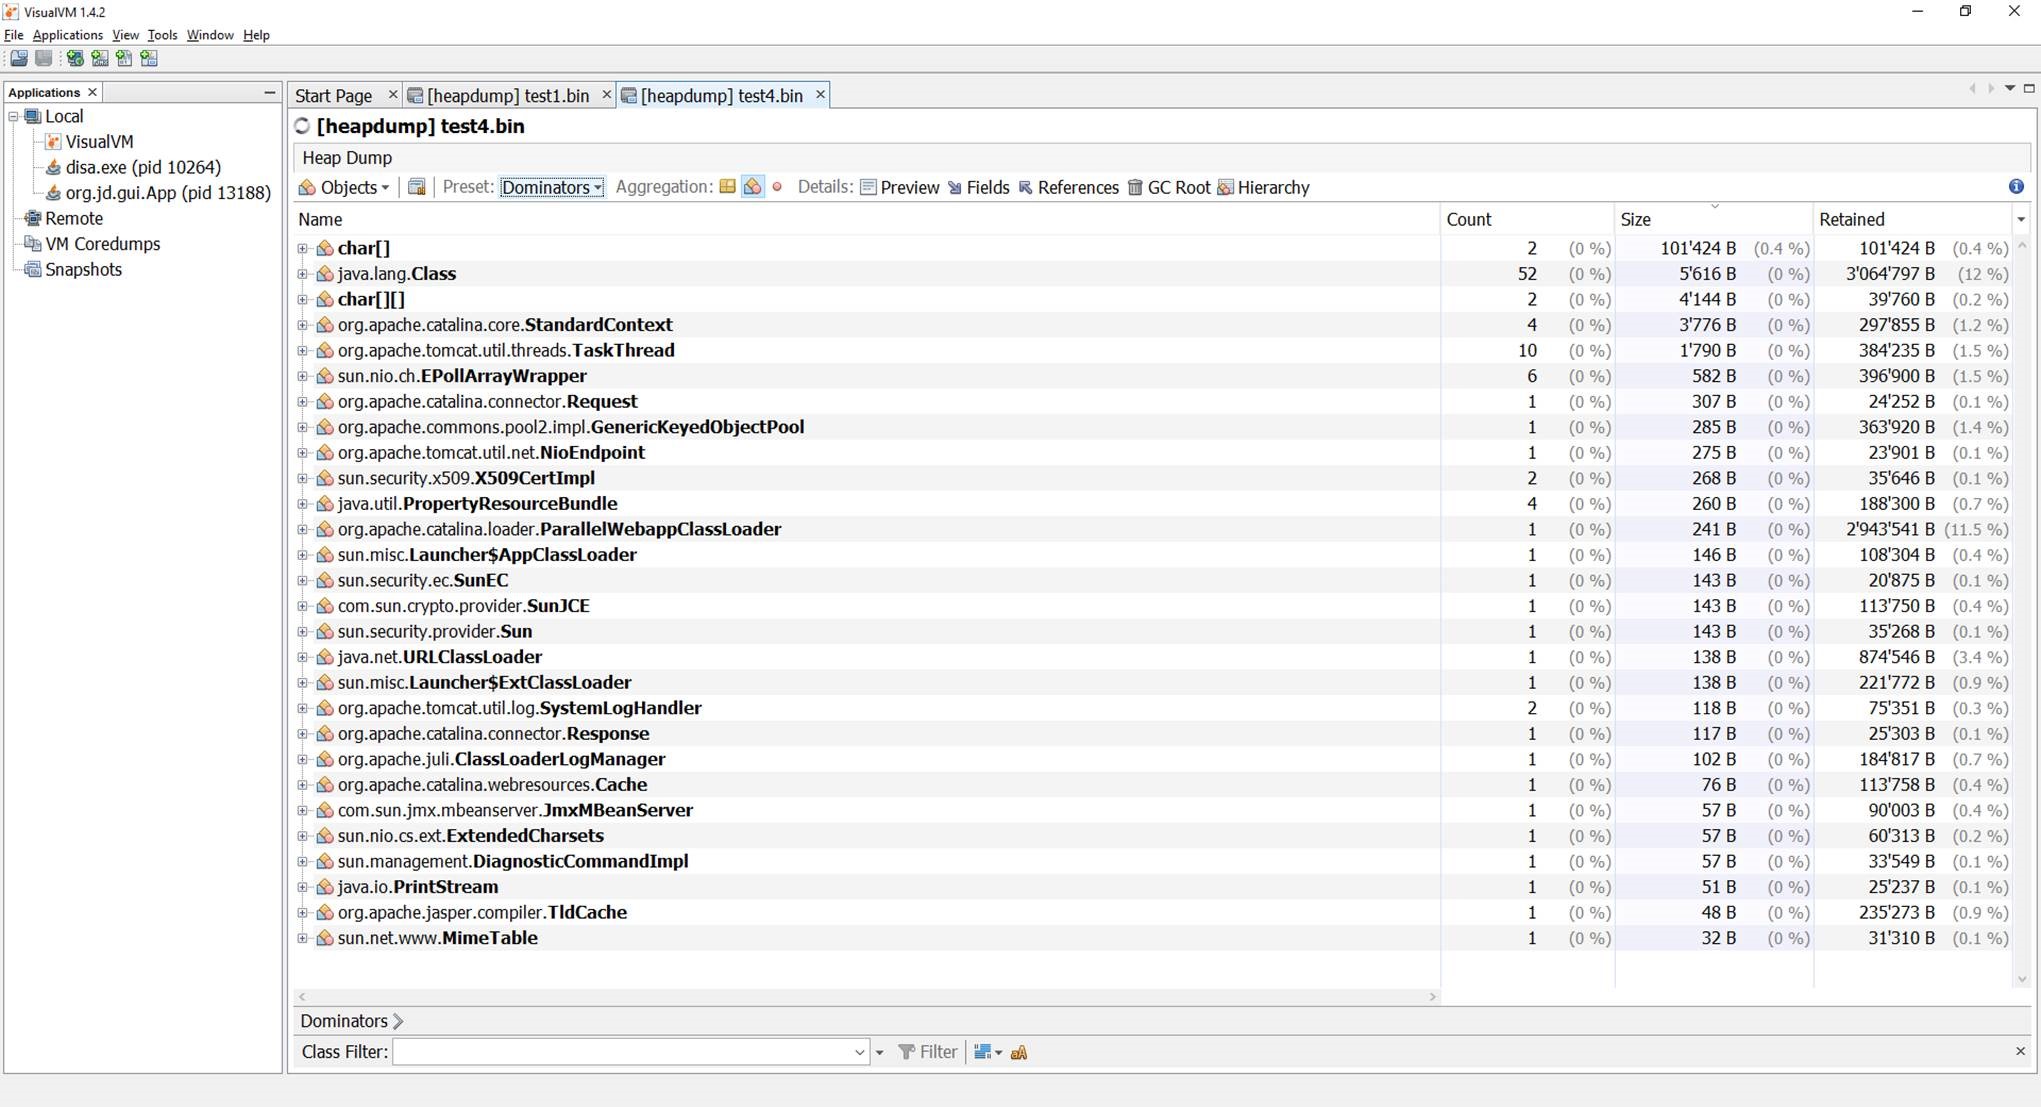
7. open visualvm and open created file
when having memory leaks by using JMSSend you can see following :
Fixing the issue calling undefined method , which executes catch block closing connection and JNDI context and actually fixing the leak looks like this :
Conclusion :
Starting with Oracle Siebel CRM IP2017 beside traditional debugging methods new skills requiring JAVA, tomcat server are required in order to monitor and fix possible issues. This blogs shows some tricks how to achieve this.